
Keno Odds
Keno odds are fixed by simple counting. 20 numbers are drawn from 80, and the chance of catching a given number of your spots depends only on how many spots you picked. The paytable then decides how much of your stake comes back. This page gives the exact odds for standard 80-number keno and shows how to calculate the return of any paytable. For the basic rules, see keno rules.
The Formula
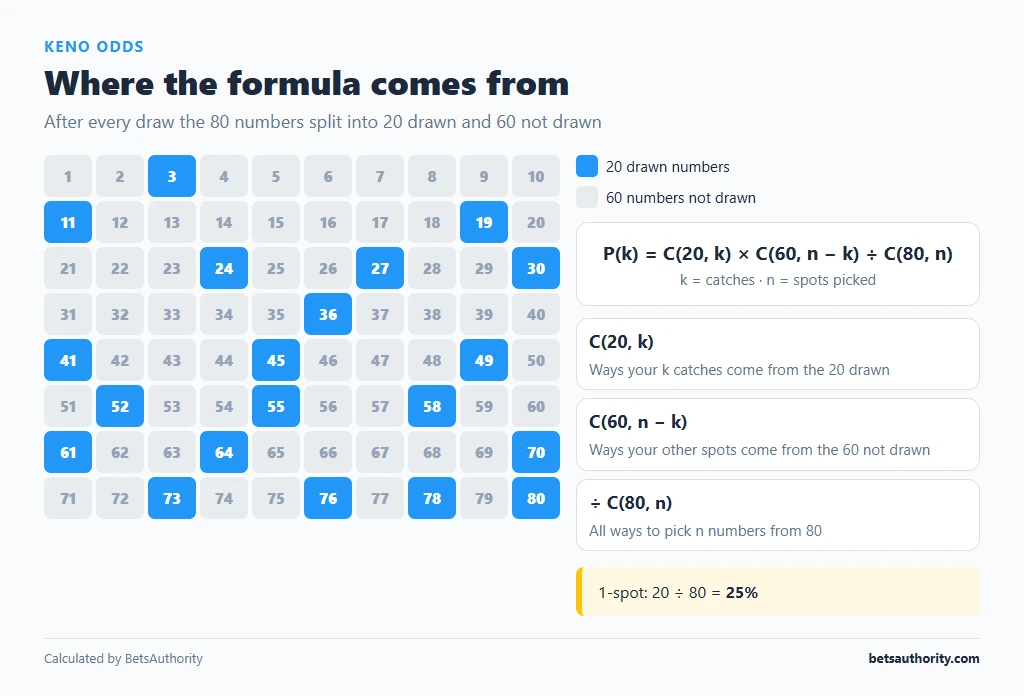
The probability of catching exactly *k* of your *n* spots is:
P(k) = C(20, k) × C(60, n − k) ÷ C(80, n)
C(a, b) is the number of ways to choose b items from a. In words: choose which k of the 20 drawn numbers are yours, choose the other n − k of your numbers from the 60 numbers that were not drawn, and divide by all the ways to pick n numbers from 80.
Example, 1-spot: C(20,1) × C(60,0) ÷ C(80,1) = 20 ÷ 80 = 25%. One number in four is drawn, so a single spot is caught one game in four.
Odds Tables by Ticket Size
Odds are shown as “1 in X” (rounded).
1 to 4 spots
| Catch | 1-spot | 2-spot | 3-spot | 4-spot |
|---|---|---|---|---|
| 0 | 1 in 1.3 | 1 in 1.8 | 1 in 2.4 | 1 in 3.2 |
| 1 | 1 in 4 | 1 in 2.6 | 1 in 2.3 | 1 in 2.3 |
| 2 | — | 1 in 16.6 | 1 in 7.2 | 1 in 4.7 |
| 3 | — | — | 1 in 72 | 1 in 23 |
| 4 | — | — | — | 1 in 326 |
5 to 7 spots
| Catch | 5-spot | 6-spot | 7-spot |
|---|---|---|---|
| 0 | 1 in 4.4 | 1 in 6.0 | 1 in 8.2 |
| 1 | 1 in 2.5 | 1 in 2.8 | 1 in 3.2 |
| 2 | 1 in 3.7 | 1 in 3.2 | 1 in 3.1 |
| 3 | 1 in 11.9 | 1 in 7.7 | 1 in 5.7 |
| 4 | 1 in 83 | 1 in 35 | 1 in 19 |
| 5 | 1 in 1,551 | 1 in 323 | 1 in 116 |
| 6 | — | 1 in 7,753 | 1 in 1,366 |
| 7 | — | — | 1 in 40,979 |
8 to 10 spots
| Catch | 8-spot | 9-spot | 10-spot |
|---|---|---|---|
| 0 | 1 in 11.3 | 1 in 15.7 | 1 in 21.8 |
| 1 | 1 in 3.8 | 1 in 4.5 | 1 in 5.6 |
| 2 | 1 in 3.0 | 1 in 3.2 | 1 in 3.4 |
| 3 | 1 in 4.7 | 1 in 4.1 | 1 in 3.7 |
| 4 | 1 in 12.3 | 1 in 8.8 | 1 in 6.8 |
| 5 | 1 in 55 | 1 in 31 | 1 in 19 |
| 6 | 1 in 423 | 1 in 175 | 1 in 87 |
| 7 | 1 in 6,232 | 1 in 1,690 | 1 in 621 |
| 8 | 1 in 230,115 | 1 in 30,682 | 1 in 7,385 |
| 9 | — | 1 in 1,380,688 | 1 in 163,381 |
| 10 | — | — | 1 in 8,911,711 |
Catching all 20 numbers on a 20-spot ticket is about 1 in 3.5 quintillion (3.5 × 10^18). Catching all 10 on a 10-spot happens about once in 8.9 million games. At one game every few minutes, that is many decades of continuous play on average.
Reading the Tables
- The most likely result is a partial catch that pays little or nothing. On a 10-spot, catching 2 or 3 numbers (56% combined) is the most common outcome.
- “Catch all” odds rise steeply. Each extra spot makes catching all of them roughly 4 to 6 times less likely: 1 in 326 for 4 of 4, 1 in 1,551 for 5 of 5, 1 in 7,753 for 6 of 6.
- Zero catches is less common on large tickets. 0 of 10 happens 4.58% of the time (1 in 21.8), which is why some 10-spot paytables pay a small prize for it.
How to Calculate a Paytable’s RTP
The return to player (RTP) is the sum of each payout multiplied by its probability.
- Look up the probability of each paying catch for your spot count (use the percentages below).
- Multiply each probability by its payout (in multiples of your stake, including the stake).
- Add the results. That total is the RTP; 100% minus the RTP is the house edge.
Example: a 5-spot paytable paying 3 of 5 = 2x, 4 of 5 = 15x, 5 of 5 = 500x.
| Catch | Probability | Payout | Contribution |
|---|---|---|---|
| 3 | 8.3935% | 2x | 16.79% |
| 4 | 1.2092% | 15x | 18.14% |
| 5 | 0.0645% | 500x | 32.25% |
| Total | 67.18% |
This example paytable returns about 67.2%, a house edge of 32.8%. The 5-of-5 line contributes almost half of the return, but you would hit it once in roughly 1,551 games. Most sessions return much less than the long-run figure.
Exact probabilities for the calculation
| Spots | Catch probabilities (%) |
|---|---|
| 4 | 2: 21.2635 · 3: 4.3248 · 4: 0.3063 |
| 5 | 2: 27.0457 · 3: 8.3935 · 4: 1.2092 · 5: 0.0645 |
| 6 | 3: 12.9820 · 4: 2.8538 · 5: 0.3096 · 6: 0.0129 |
| 8 | 4: 8.1504 · 5: 1.8303 · 6: 0.2367 · 7: 0.0160 · 8: 0.0004 |
| 10 | 0: 4.5791 · 5: 5.1428 · 6: 1.1479 · 7: 0.1611 · 8: 0.0135 · 9: 0.0006 · 10: 0.00001 |
Heads or Tails Odds
For games that offer a Heads or Tails bet on the split of the 20 drawn numbers between 1–40 and 41–80:
| Result | Probability |
|---|---|
| Heads (11+ from 1–40) | 39.84% |
| Tails (11+ from 41–80) | 39.84% |
| Evens (10 and 10) | 20.32% |
A Heads bet paying 2 for 1 (stake included) returns 79.7%. The payout set by the operator decides the actual edge.
What the Numbers Mean for Players
- Compare spot counts within the same game. Providers often set different RTPs for different ticket sizes.
- Expect long losing runs. On most paytables you lose more than half your games.
- Treat the top prize as a lottery. It contributes to the RTP, but you are unlikely to see it in any normal playing lifetime on 9- or 10-spot tickets.
- Use time and loss limits. Fast online keno can run several games per minute; see setting limits.
For background on how probability and house edge relate, read understanding casino odds and payout percentage. Casinos with instant keno titles include Wild Tornado. The keno guide hub lists every keno page.
Frequently Asked Questions
About 1 in 8,911,711 in standard 80-number keno with 20 numbers drawn.
25%. Twenty of the 80 numbers are drawn, so any single number is drawn one game in four.
Multiply each payout (including the stake) by its probability for your spot count and add the results. The total is the RTP.
There is no single answer: the return depends on the paytable, not the spot count. Calculate or read the RTP for each ticket size in the game you play.
No. Every draw is independent, and every set of numbers has the same probability of being drawn.
Keno outcomes are random and paytables carry a house edge. Play only if you are 18 or older; Gambling Help Online (1800 858 858) is free and confidential.