
Australian Gambling Statistics
This page collects gambling statistics for Australia from official sources only: the Australian Institute of Health and Welfare (AIHW), the Queensland Government Statistician’s Office (QGSO) Australian Gambling Statistics, the HILDA Survey as reported by the AIHW, the Australian Gambling Research Centre (AGRC), ACMA and the Department of Social Services (DSS). Each figure names its source and period. Figures from different surveys use different methods and should not be combined.
Gambling Spending (Net Losses)
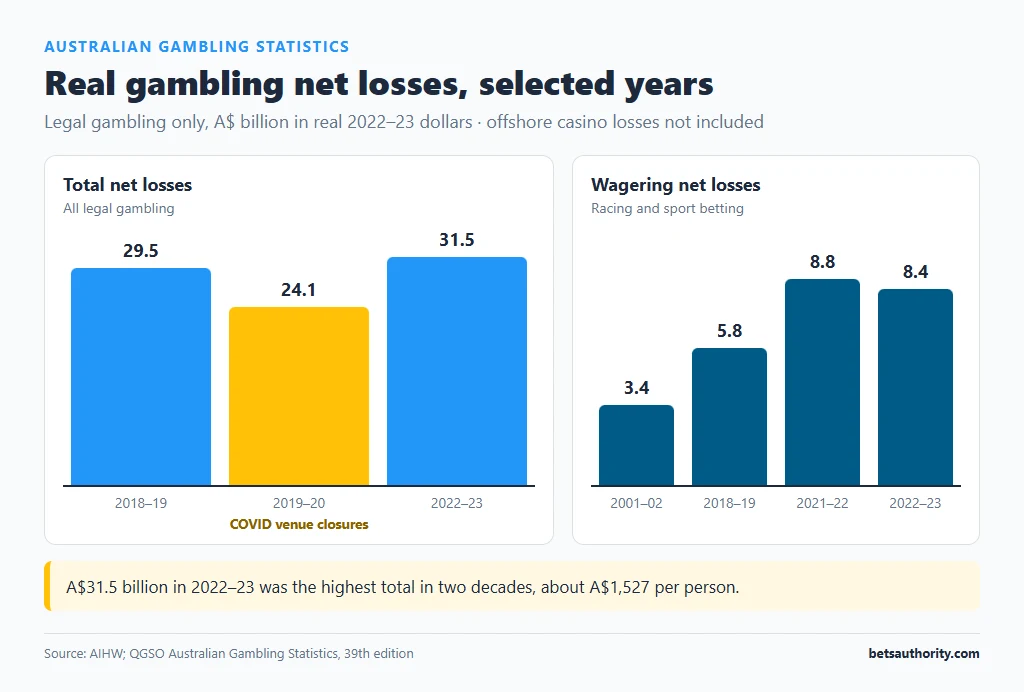
Source: AIHW, using QGSO Australian Gambling Statistics, 39th edition. Expenditure means net losses (amount wagered minus amount won) on legal gambling, in real 2022–23 dollars.
| Measure | Figure |
|---|---|
| Total net losses, 2022–23 | A$31.5 billion, the highest in two decades |
| Per capita net losses, 2022–23 | About A$1,527 (up from A$1,461 in 2021–22, real terms) |
| Total net losses, 2018–19 | A$29.5 billion |
| Total net losses, 2019–20 (COVID venue closures) | A$24.1 billion |
| Wagering net losses, 2001–02 | A$3.4 billion |
| Wagering net losses, 2018–19 | A$5.8 billion |
| Wagering net losses, 2021–22 | A$8.8 billion |
| Wagering net losses, 2022–23 | A$8.4 billion |
By product, 2022–23
| Product | Net losses | Share of total |
|---|---|---|
| Gaming machines (pubs and clubs) | A$15.76 billion | 50% |
| Wagering | A$8.40 billion | 27% |
| Casinos | A$3.61 billion | 11% |
| Lotteries | A$3.11 billion | 10% |
| Keno | A$0.47 billion | 1.5% |
| Interactive gaming (legal) | A$0.04 billion | 0.1% |
QGSO has since published later editions (the 41st edition covers 2024–25). These series count legal gambling only; money lost at offshore online casinos is not included.
Participation
Source: HILDA Survey 2024 report (Wilkins et al.), as summarised by the AIHW. Figures refer to a typical month in 2022.
| Activity | Men | Women |
|---|---|---|
| Lotto or lottery games | 28.6% | 24.0% |
| Betting on horse or dog races | 10.1% | 2.2% |
| Betting on sports | 9.3% | 1.1% |
| Poker machines | 7.3% | 5.1% |
| Instant scratch tickets | 4.9% | 5.6% |
| Casino table games | 1.0% | 0.2% |
Trends from 2015 to 2022 (HILDA, typical month):
- Lotto or lottery participation fell from 30% to 26% of adults.
- Instant scratch tickets fell from 8.5% to 5.3%.
- Sports betting rose from 3.3% to 5.1%; among men from 5.6% to 9.3%.
- Grattan Institute analysis of HILDA found the share of men aged 18–24 placing a bet in a regular month rose from 10% to 17%, and for men aged 25–34 from 11% to 17%.
- Average self-reported monthly spending on poker machines among those who used them was A$241.09 in 2022, almost double the A$120.66 recorded in 2015 (real terms).
Betting and spending detail
Source: Grattan Institute analysis of HILDA and the HILDA 2024 report, both as summarised by the AIHW.
| Measure | 2015 | 2022 |
|---|---|---|
| Adults who placed a bet in a typical month | 7.1% | 8.1% |
| Men who placed a bet in a typical month | 12% | 14% |
| Women who placed a bet in a typical month | 2.6% | 2.7% |
| Average monthly spend on horse or dog races (those who bet, real terms) | A$115.03 | A$147 |
| Average monthly spend on sports betting (those who bet, real terms) | A$85.61 | A$102.66 |
The share of men aged 45–54 who placed a bet in a regular month fell over the same period, from 15% to 12%, so the growth in betting is concentrated among younger men.
Risk and Harm
Source: HILDA Survey 2024 report, via AIHW. Categories use the Problem Gambling Severity Index (PGSI).
| PGSI category (share of adults) | 2018 | 2022 |
|---|---|---|
| Low-risk gambling | 3.7% | 4.9% |
| Moderate-risk gambling | 2.5% | 3.1% |
| High-risk (“problem”) gambling | 1.1% | 1.8% |
In 2022, 2.4% of men (about 310,000) and 1.2% of women (about 157,000) reported high-risk gambling. Separately, the 2019 National Telephone Survey of the Interactive Gambling Study (Hing et al. 2021) estimated that 6.0% of Australian adults had been harmed by someone else’s gambling.
The most common harms reported by people affected by someone else’s gambling were feeling angry, distressed or hopeless about it, and greater tension and conflict in relationships. Less spending money or savings, lost sleep and less enjoyment of time with family were also common. Family members, including partners and former partners, were the group most often affected; see helping a family member.
For what these categories mean in practice, see signs of problem gambling.
Online Gambling
| Statistic | Source |
|---|---|
| 11% of Australians had gambled online in the previous 6 months in 2022, up from 8% in 2020 | ACMA research, cited by DSS |
| 5% of adults who gambled online reported using an offshore betting site or app in the previous 6 months | ACMA annual consumer survey, 2021 |
| More than one million gambling ads aired on free-to-air TV and metropolitan radio from May 2022 to April 2023; 50% were for online gambling providers | ACMA (2023), via AIHW |
Enforcement and Self-Exclusion
| Statistic | Source |
|---|---|
| 1,708 illegal gambling and affiliate websites blocked from November 2019 to 21 May 2026 | ACMA |
| More than 230 illegal services withdrew from the Australian market since the 2017 reforms | ACMA |
| April–June 2026: 465 enquiries and complaints, 56 IGA breaches found, 187 websites referred for blocking | ACMA quarterly report |
| 65,430 BetStop registrations from 21 August 2023 to 30 June 2026; 40,160 active exclusions on 30 June 2026 | ACMA BetStop statistics |
| 30,081 BetStop registrants were aged 30 or under | ACMA BetStop statistics |
Details: ACMA blocked sites and BetStop.
Reading These Numbers Correctly
- Net losses are not turnover. A$31.5 billion is what people lost after winnings, not what they bet.
- Survey figures are self-reported and the AIHW notes they may underestimate spending.
- Different sources, different methods. HILDA, AGRC panel surveys and ACMA surveys use different samples and questions.
- Offshore play is largely invisible in official spending data.
- COVID-19 affected 2019–20 to 2021–22 data because venues closed.
Our page on online vs land-based gambling uses these figures to compare channels, and house edge explained shows why aggregate losses rise with turnover.
Primary source: AIHW: Gambling (Australia’s welfare).
This guide is part of our online gambling in Australia section, which covers the law, licences, complaints and player protections.
Frequently Asked Questions
The AIHW, using QGSO data, reports A$31.5 billion in net losses on legal gambling in 2022–23, or about A$1,527 per capita.
Gaming machines in pubs and clubs: A$15.76 billion in 2022–23, about half of all legal gambling losses. Wagering was second at A$8.4 billion.
ACMA research cited by DSS found 11% of Australians had gambled online in the previous six months in 2022, up from 8% in 2020.
The HILDA Survey found 1.8% of adults were high-risk gamblers in 2022, up from 1.1% in 2018, with a further 3.1% at moderate risk.
No. The Australian Gambling Statistics measure legal, regulated gambling, so losses at offshore casinos are not counted.
Gambling is for adults 18+ only. If gambling is causing harm, call Gambling Help Online on 1800 858 858 (free, 24/7).